Monitoring with Amazon CloudWatch
Amazon CloudWatch is a system monitoring and observation service on AWS. In this project, CloudWatch helps monitor the entire inference pipeline — from Lambda, SageMaker Endpoint, to DynamoDB — to ensure performance, detect errors early, and optimize costs.
🎯 Goals of this section
- Collect and monitor logs from Lambda and SageMaker.
- Create custom metrics to track inference count, latency, and errors.
- Set up alarms when model or API performance is problematic.
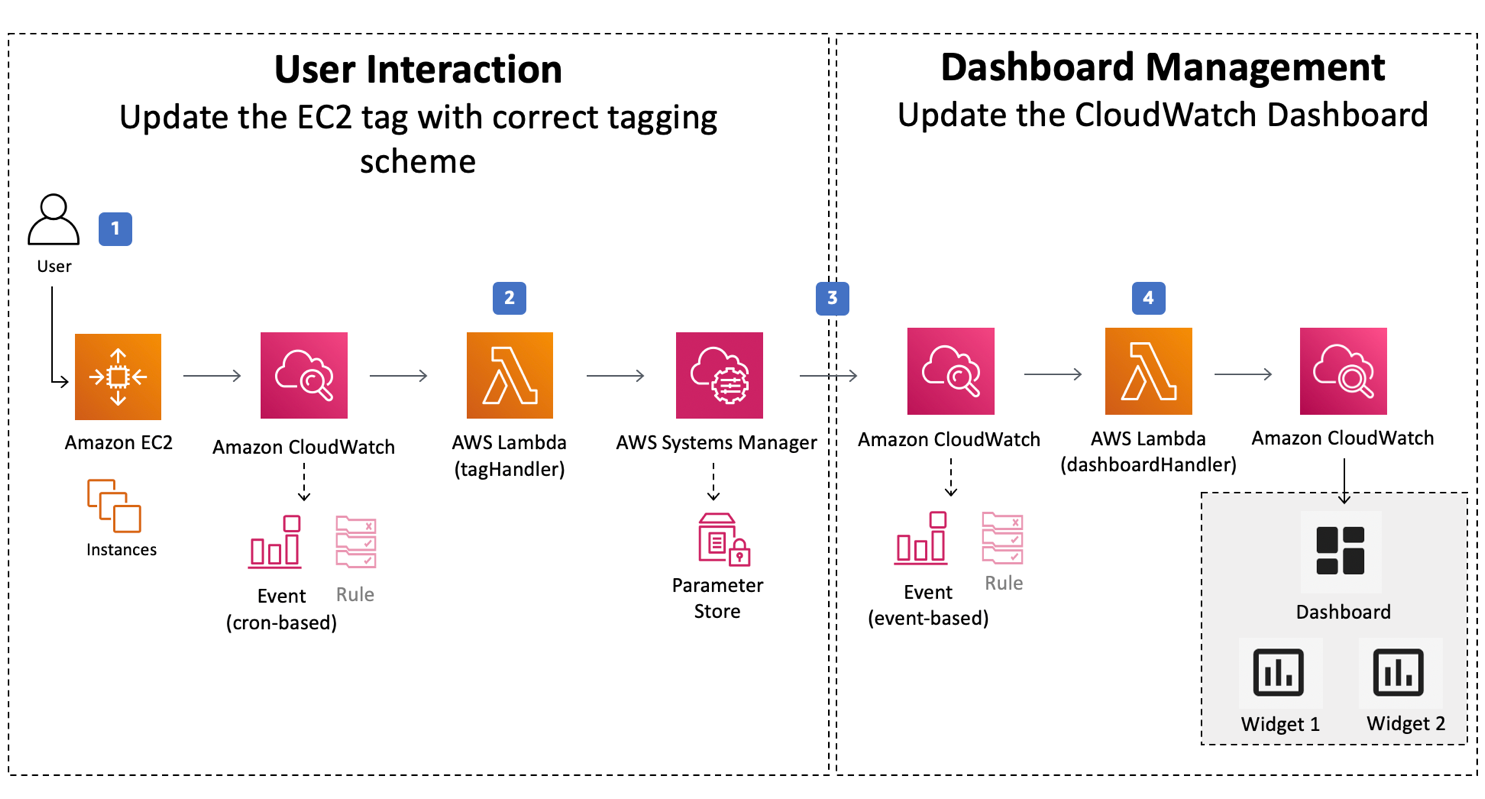
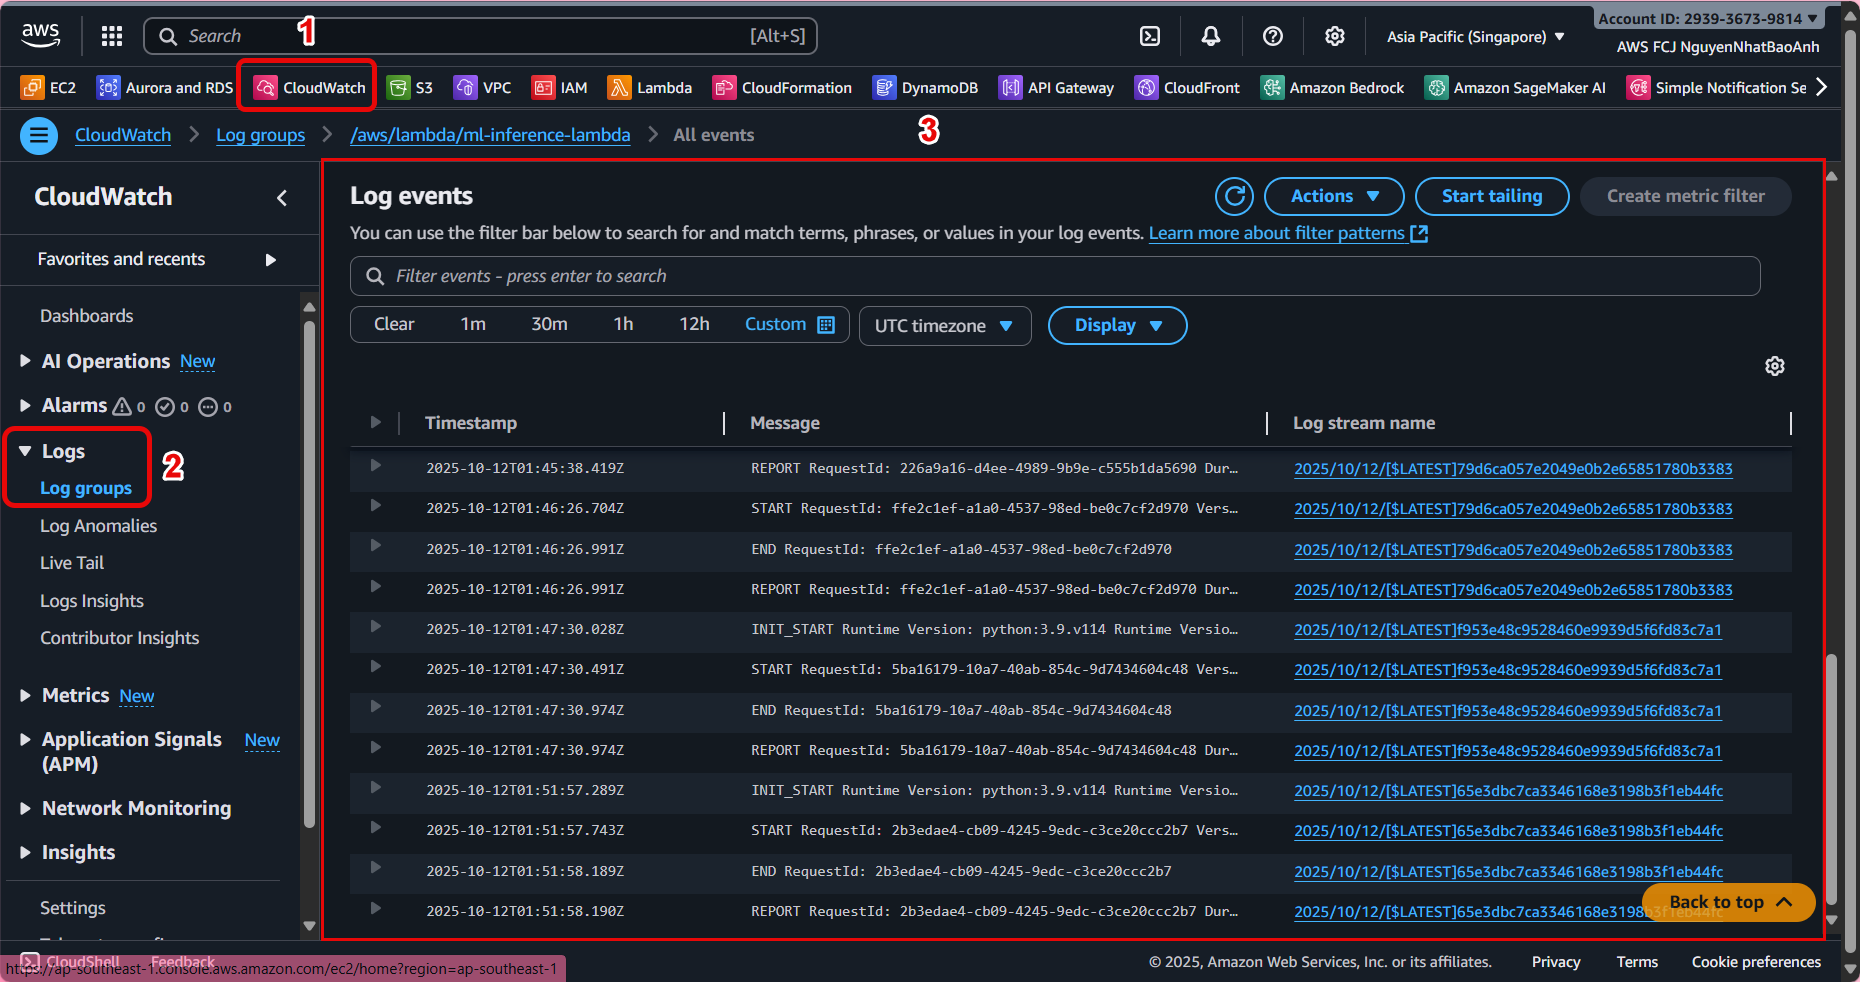
1. Check logs from Lambda and SageMaker
📜 Log Lambda
- Go to Amazon CloudWatch → Logs → Log groups.
- Find the log group corresponding to Lambda (e.g.
/aws/lambda/ml-inference-lambda). - Check the details of each inference call, including:
- Time to call the endpoint.
- Input/output data.
- Inference time (
latencyMs). - Errors (if any).
📜 Log SageMaker Endpoint
- Go to Amazon CloudWatch → Logs → Log groups.
- Find the log group prefixed with
/aws/sagemaker/Endpoints/and select the corresponding endpoint. - View the log for information:
- How many times the model was called.
- The response time of the model container.
- Errors during inference processing.
Combine Lambda and SageMaker logs for faster error diagnosis when inference fails.
2. Create Custom Metrics from Lambda
For more detailed monitoring (e.g., inferences per minute, average latency), you can send Custom Metrics from Lambda to CloudWatch.
Update the Lambda function as follows:
import boto3
import time
import os

cloudwatch = boto3.client('cloudwatch')

def publish_metrics(latency_ms, success=True):
cloudwatch.put_metric_data(
Namespace='InferencePipeline',
MetricData=[
{
'MetricName': 'LatencyMs',
'Value': latency_ms,
'Unit': 'Milliseconds'
},
{
'MetricName': 'SuccessCount' if success else 'ErrorCount',
'Value': 1,
'Unit': 'Count'
}
]
)

# Call this function after each successful inference
publish_metrics(latency_ms, success=True)
- Namespace: metric group name (InferencePipeline).
- LatencyMs: inference processing time.
- SuccessCount/ErrorCount: number of successful or error calls.
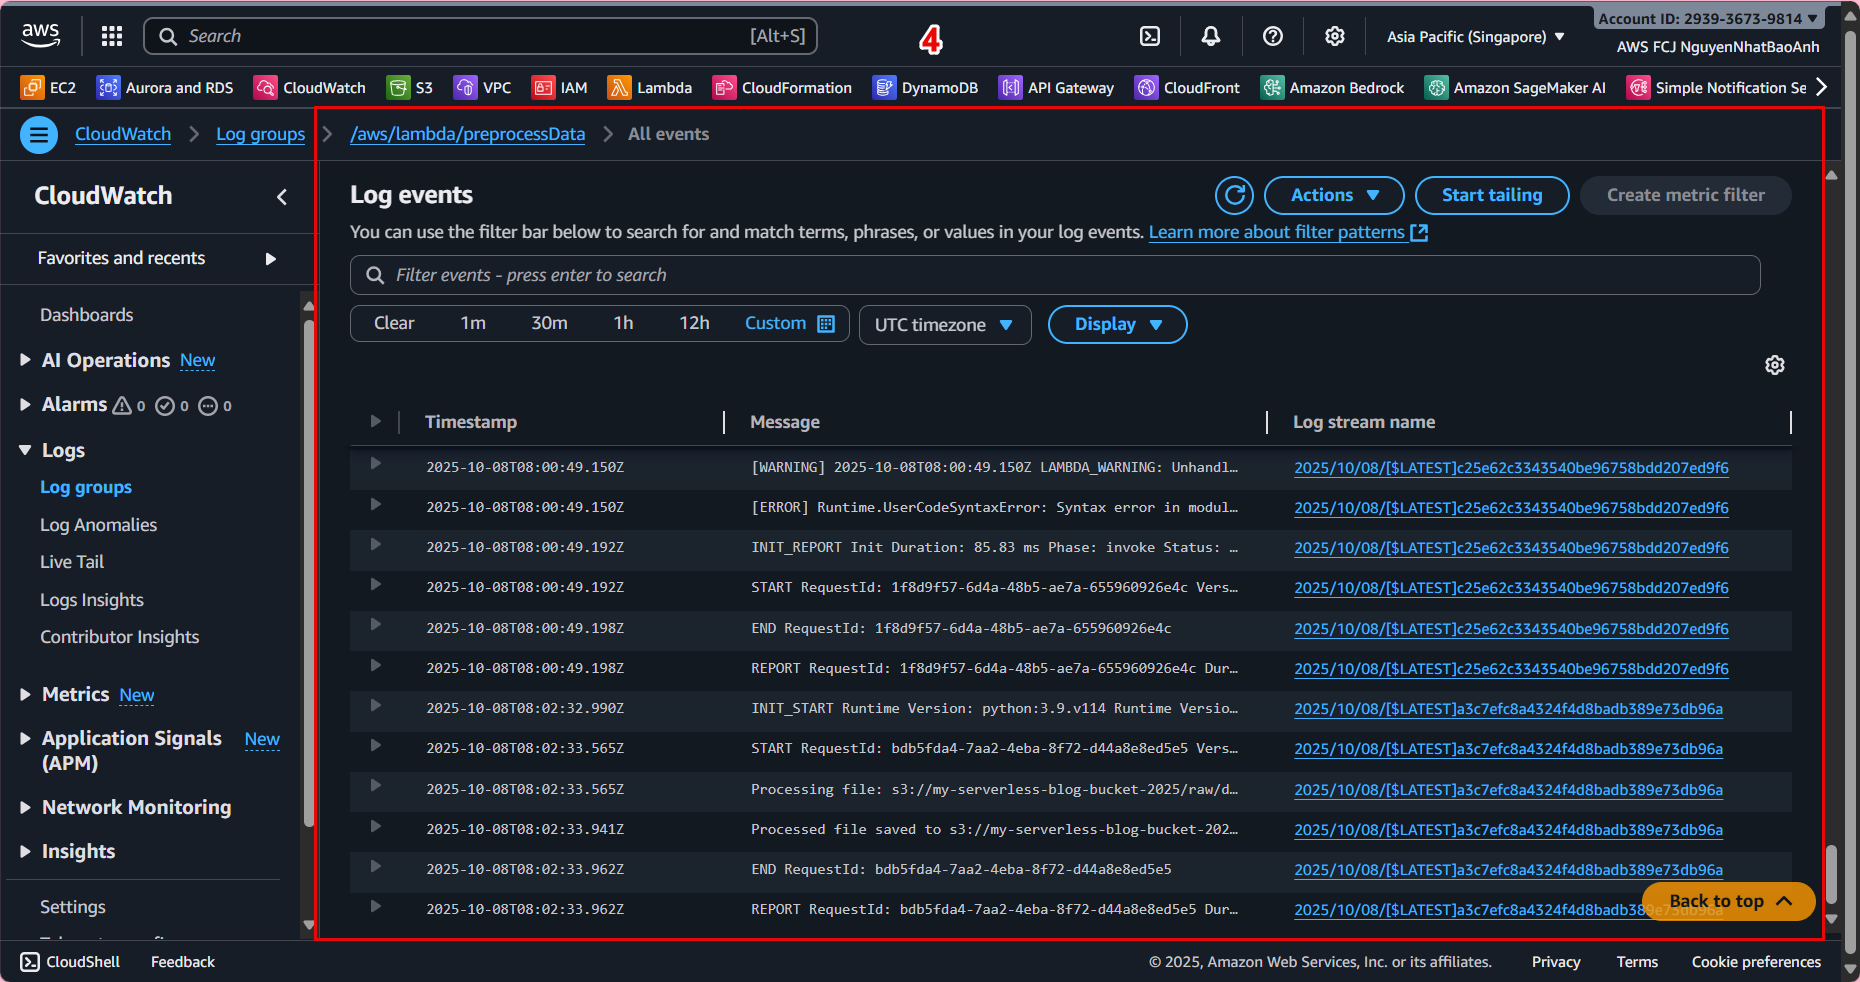
3. Create a pipeline monitoring dashboard
- Go to CloudWatch → Dashboards → Create dashboard.
- Name: Inference-Monitoring-Dashboard.
- Add widgets:
- 📊 Metric graph: LatencyMs chart over time.
- 📈 Number: total number of successful inferences (SuccessCount).
- ❌ Number: total number of error inferences (ErrorCount).
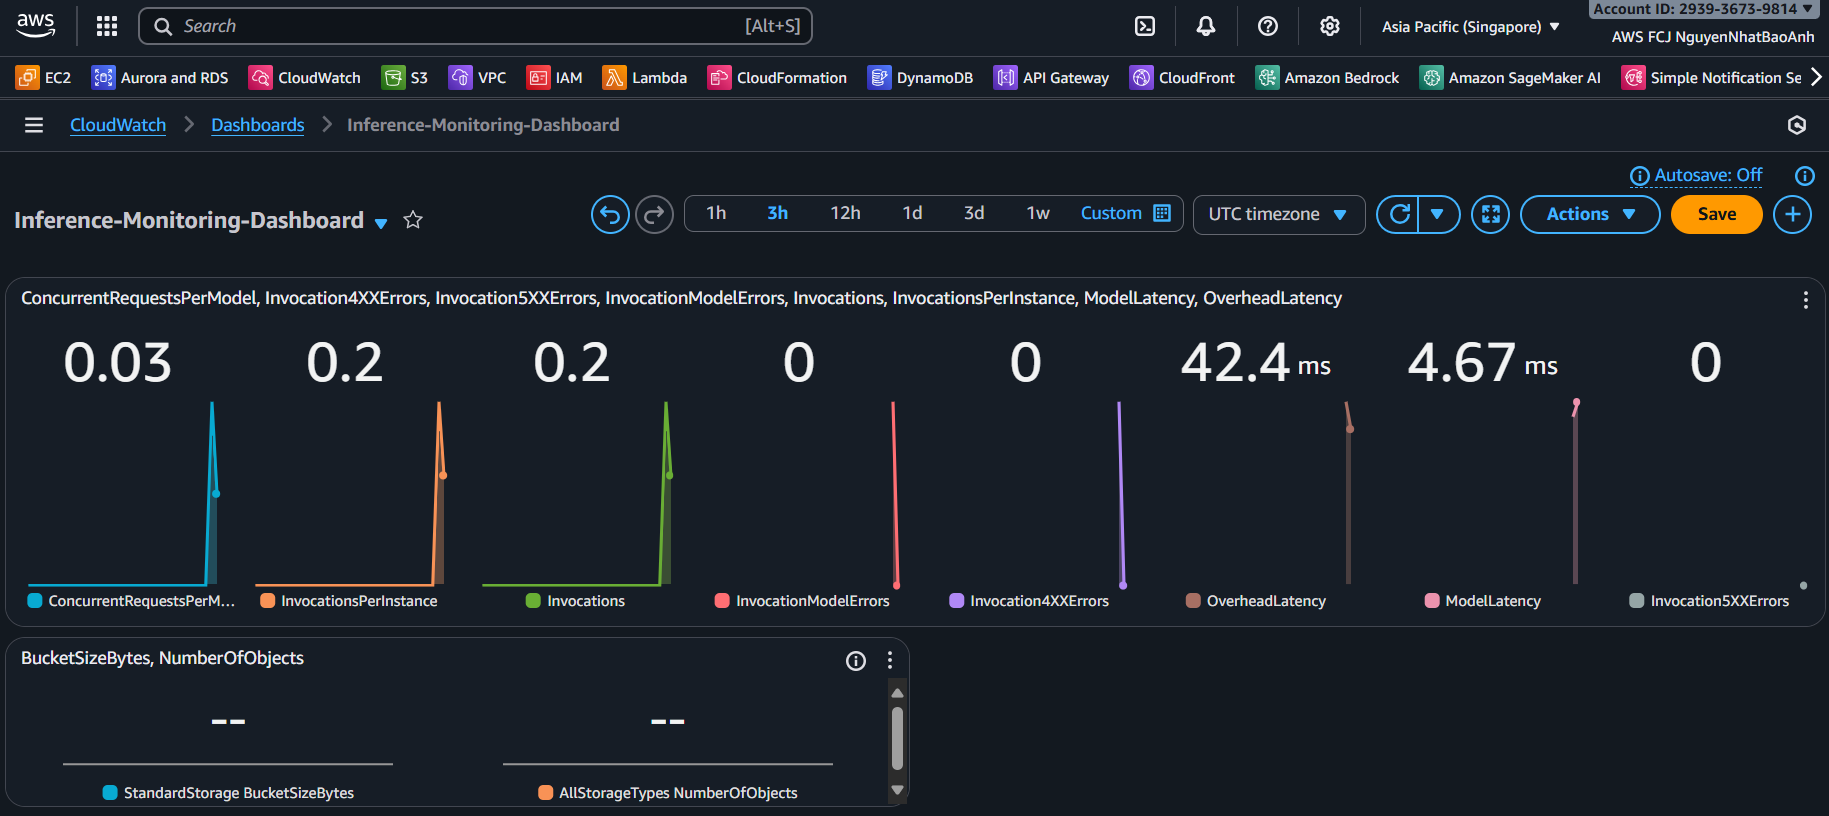
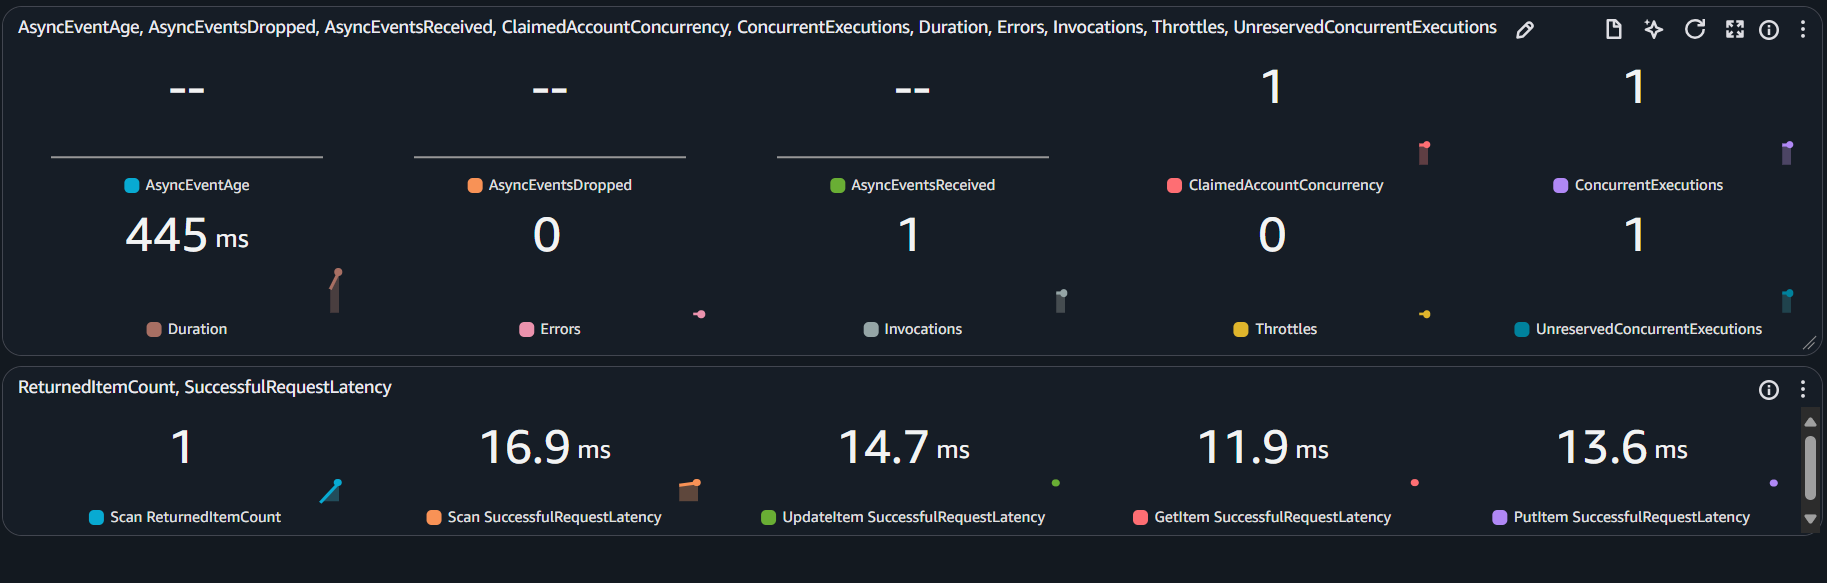
Dashboard helps you monitor performance in real time, supporting model and resource optimization.
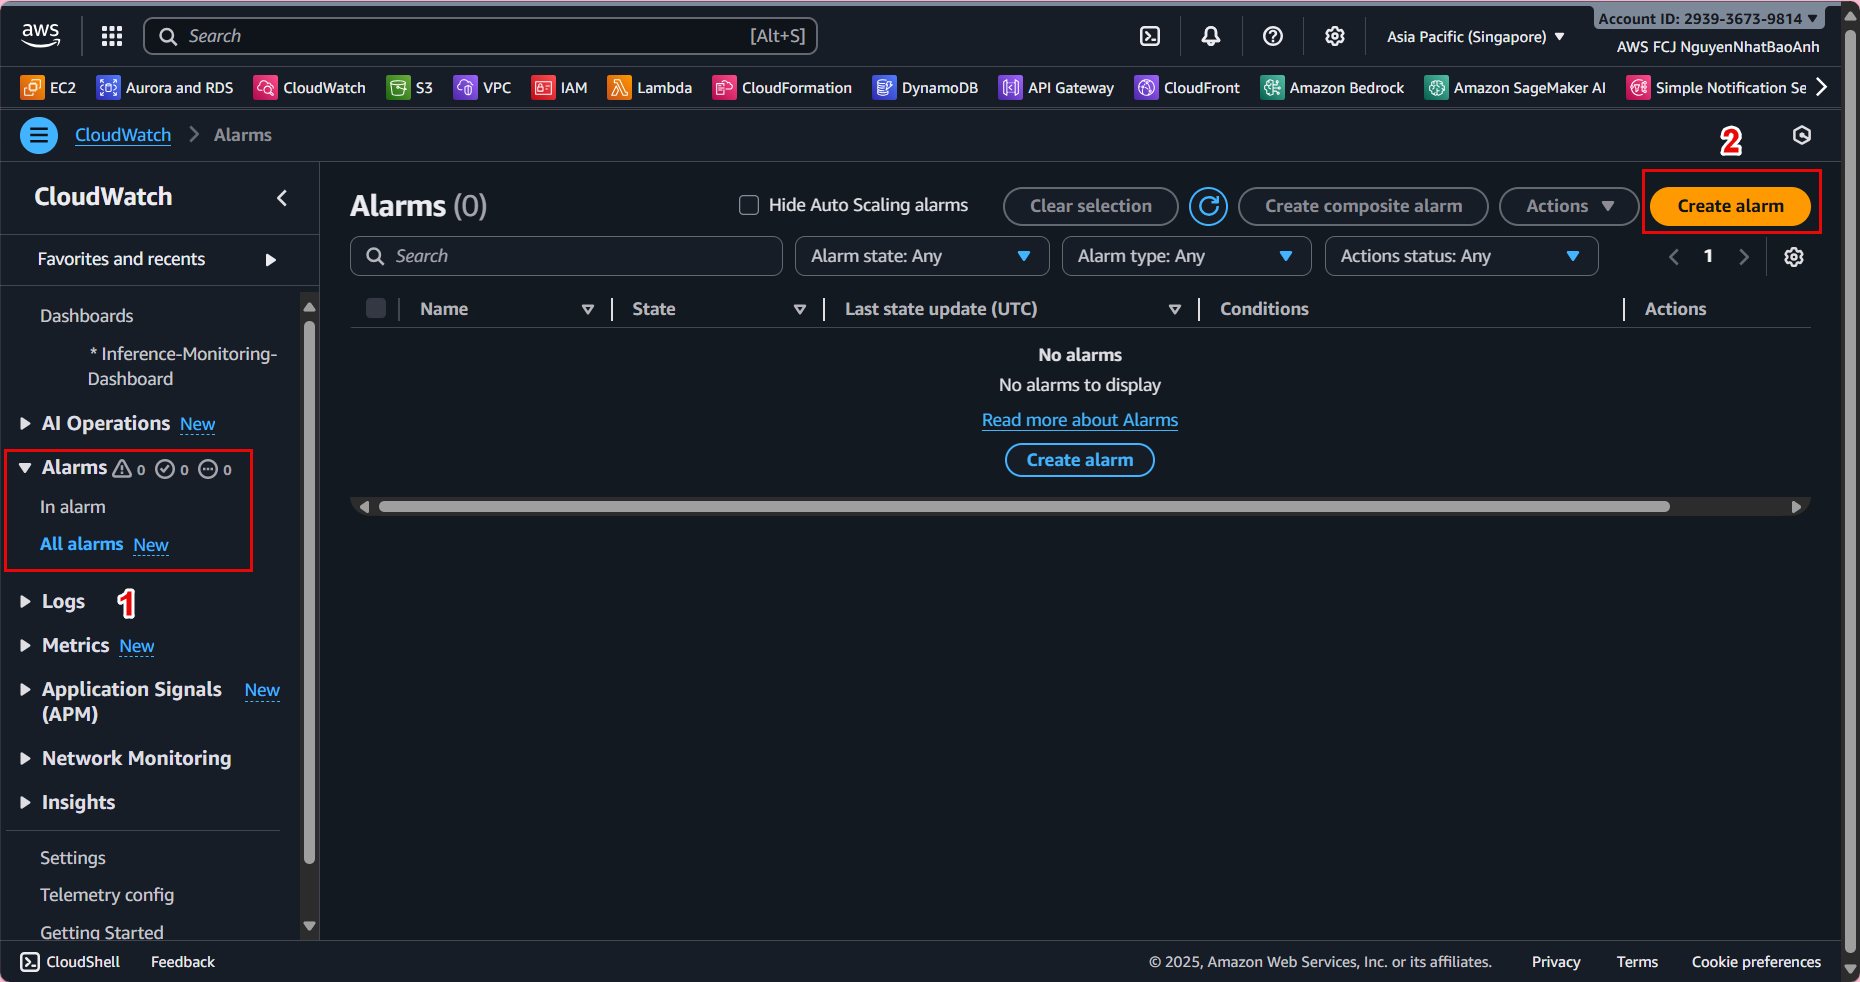
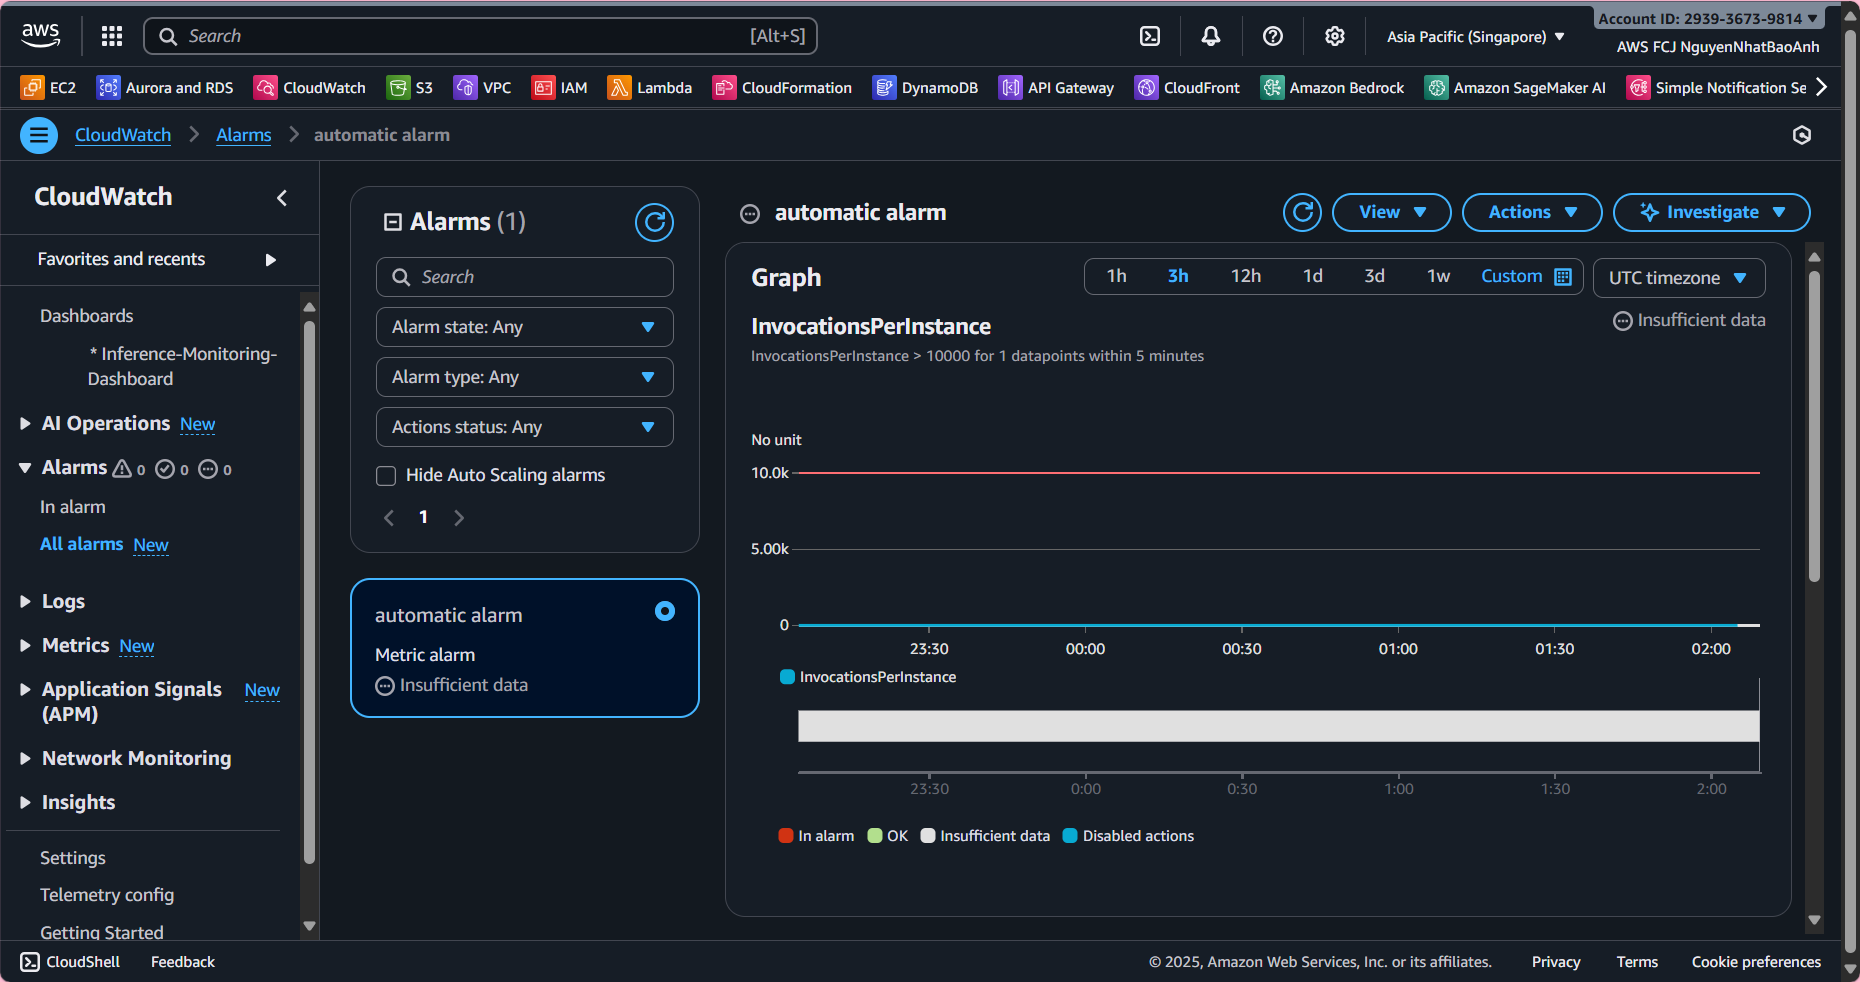
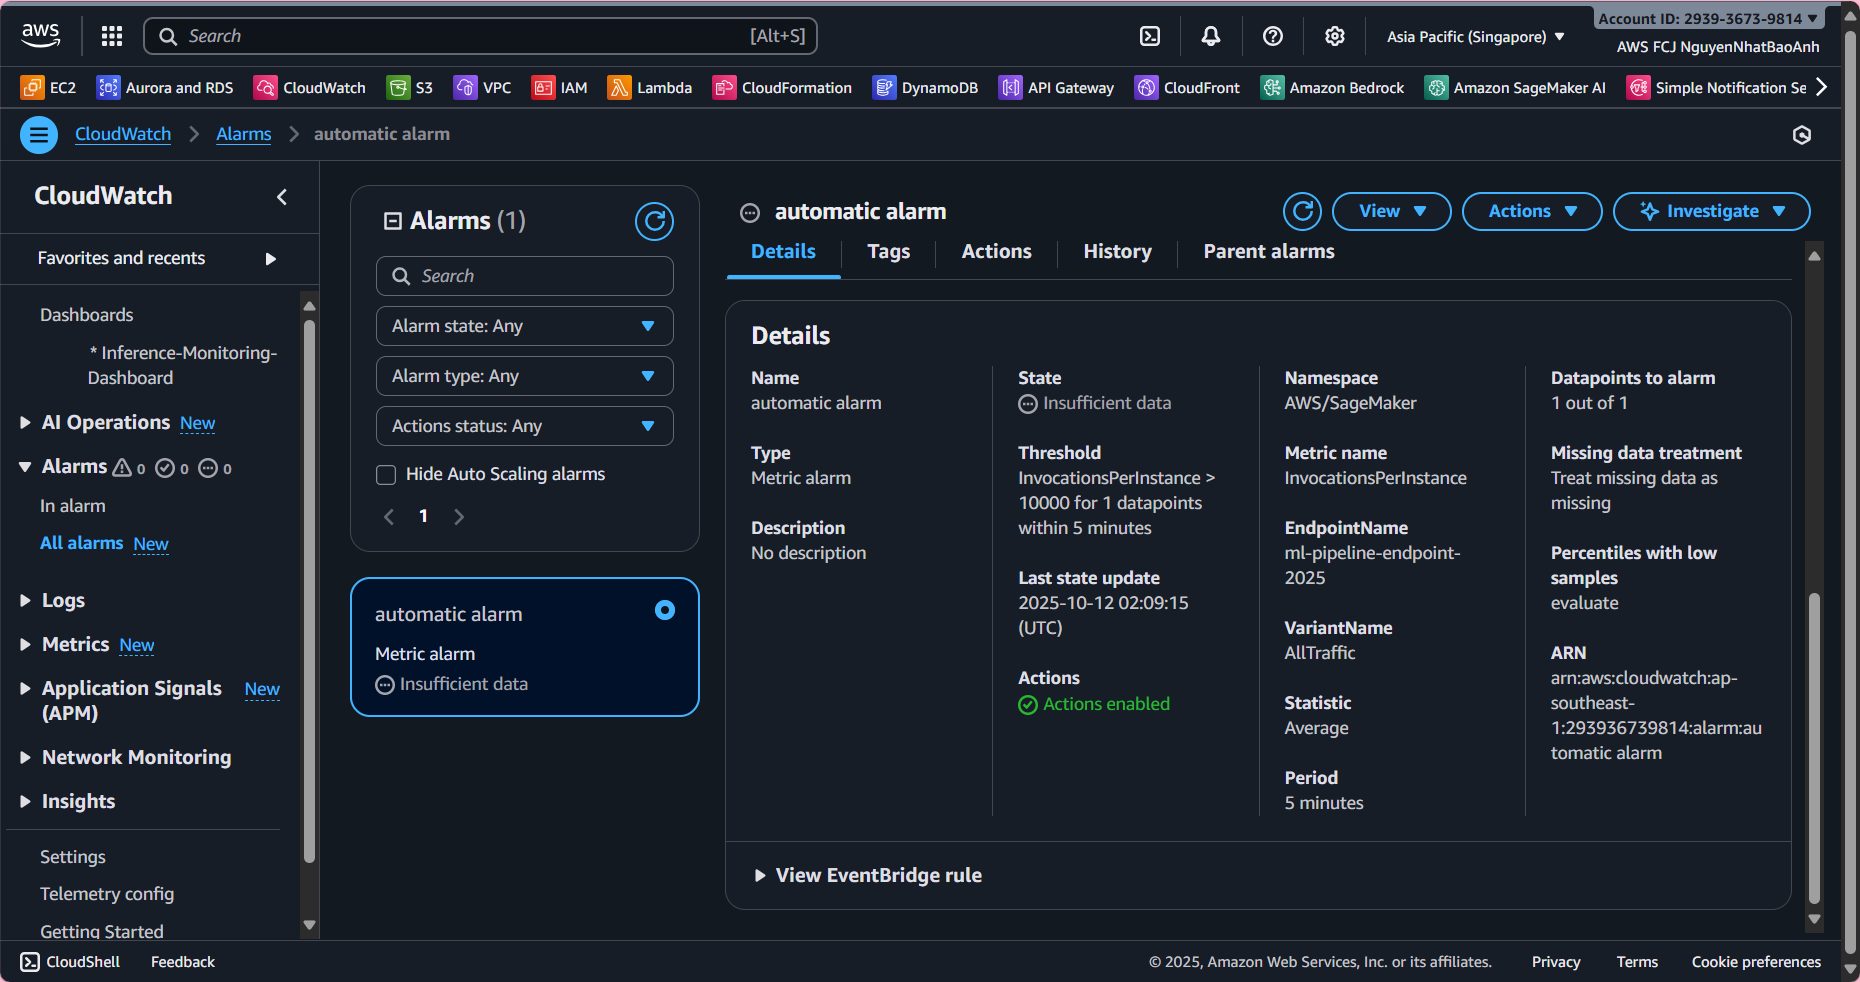
4. Create an automatic alarm
To receive alerts when the system has problems:
- Go to CloudWatch → Alarms → Create alarm.
- Select metric:
- LatencyMs > 2000 ms (2 seconds).
- Or ErrorCount > 0.
- Configure action:
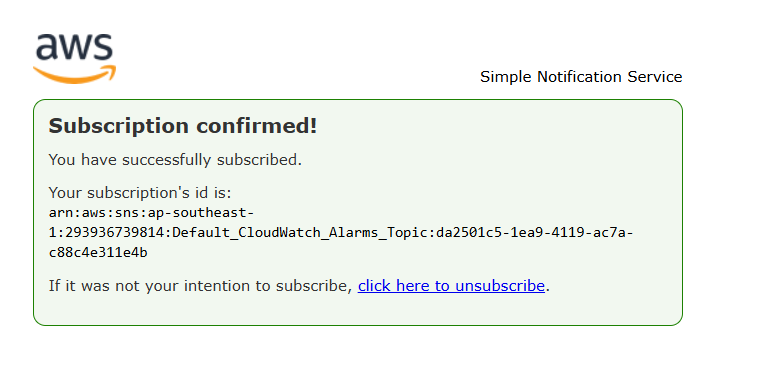
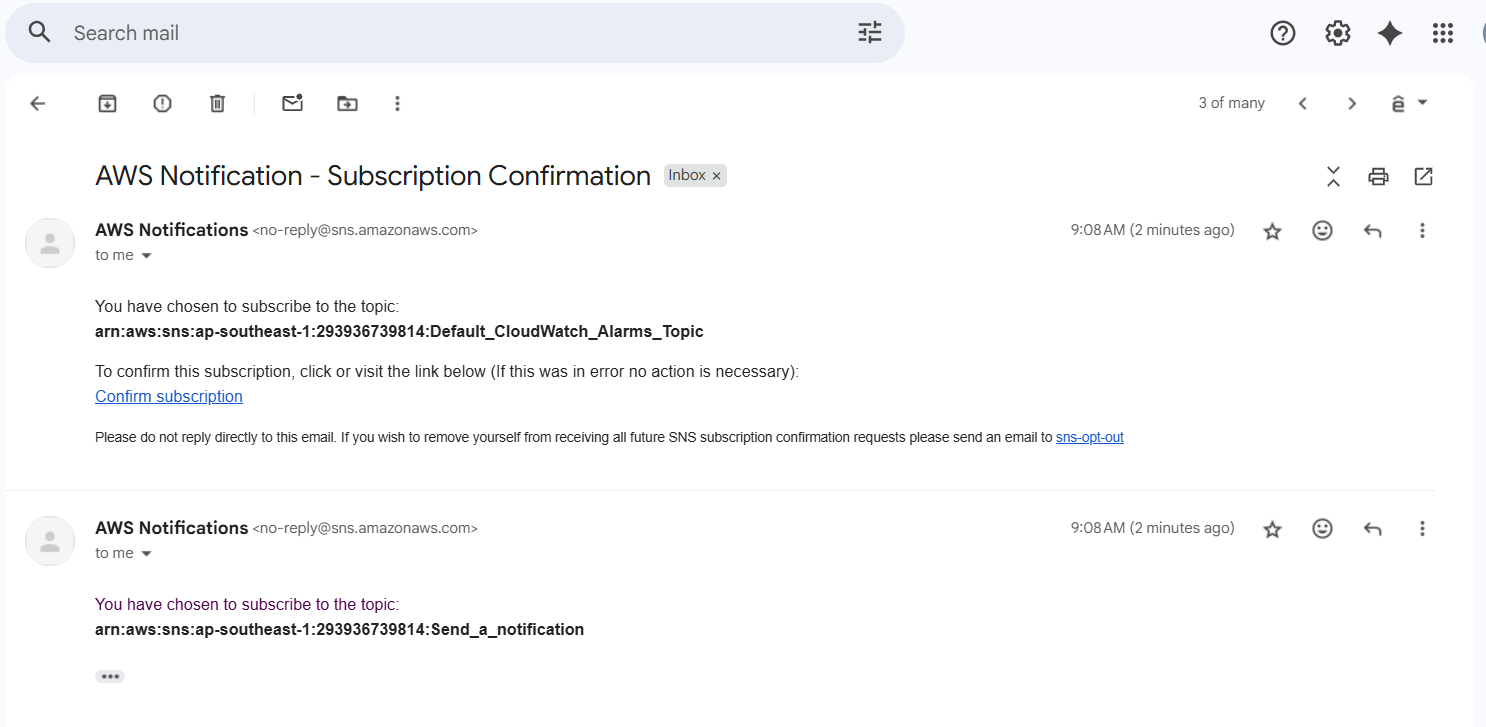
- Send notification via Amazon SNS (email, SMS).
- Name: High-Latency-Alarm or Inference-Error-Alarm.
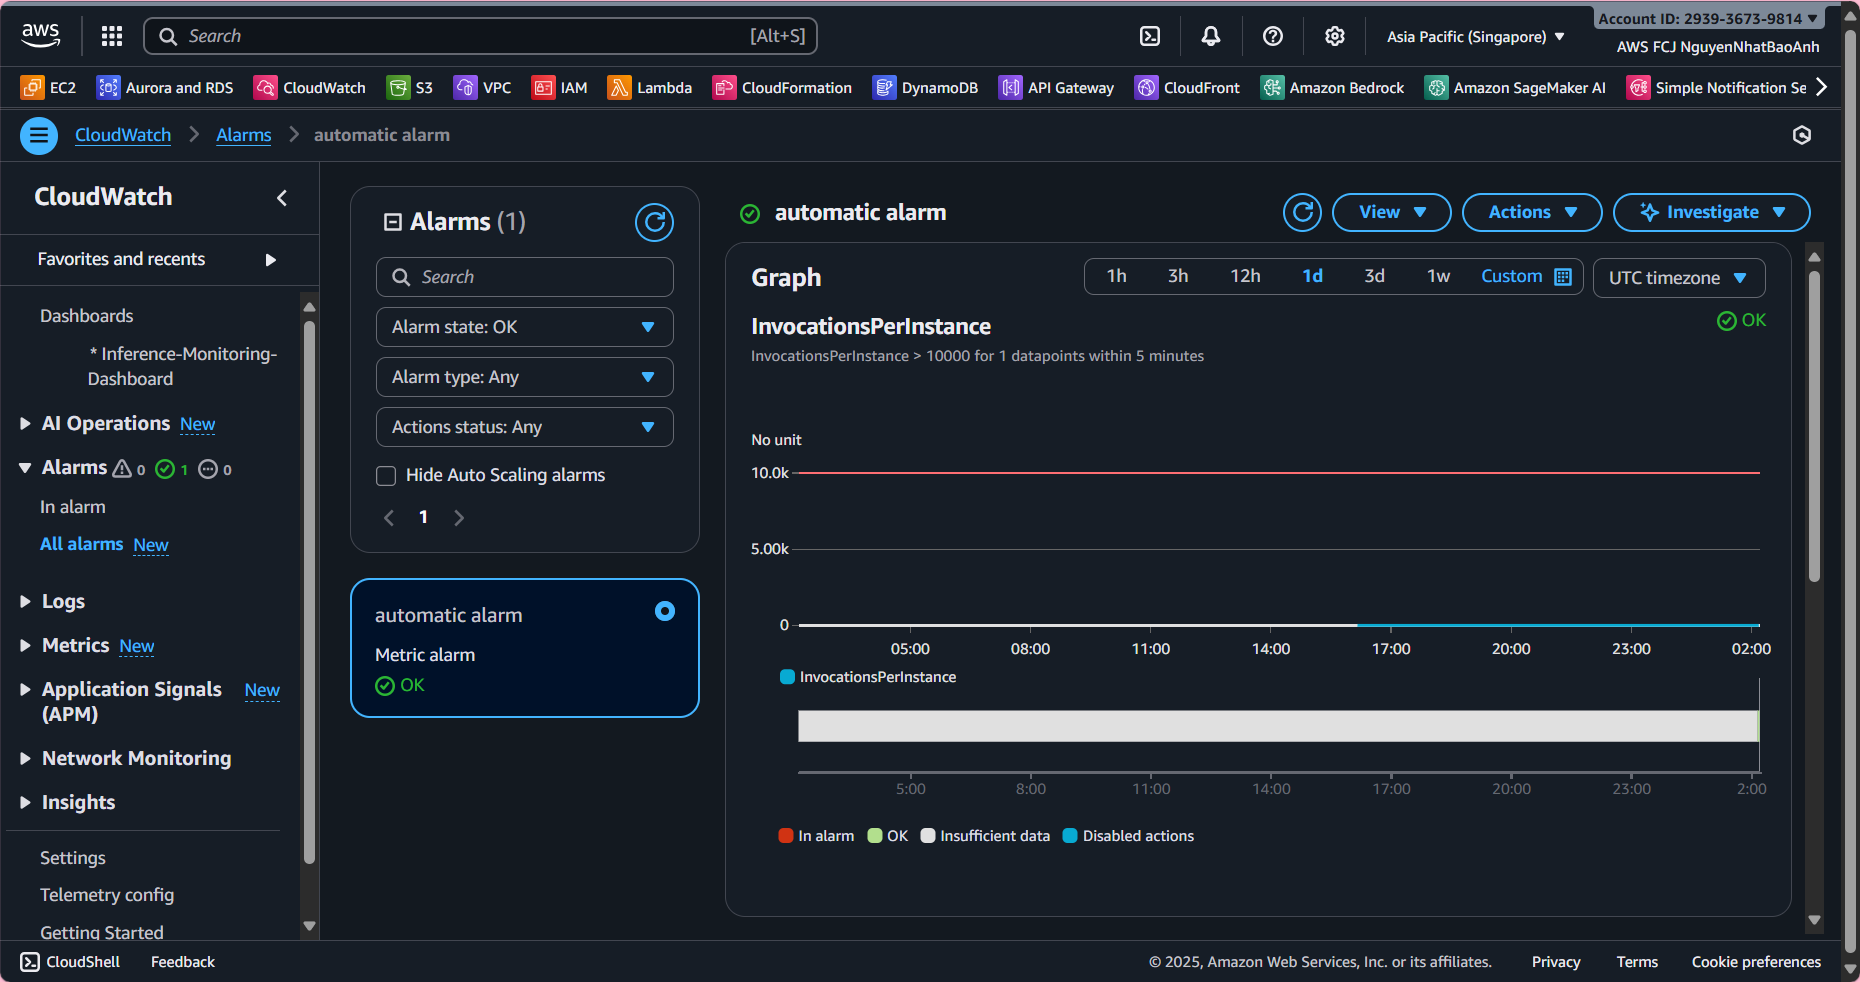
5. Check the entire inference flow
- Send a few requests to the inference API.
- Check:
- 📜 Lambda and SageMaker logs are fully displayed.
- 📊 Dashboard shows the number of inferences and latency.
- 🚨 Alarms are triggered if the threshold is exceeded.
If you don’t see metrics, check Lambda’s IAM permissions (cloudwatch:PutMetricData). Make sure Lambda sends metrics after each inference. Check the time zone when reading dashboard data.
✅ Done
- You have integrated and monitored your entire inference pipeline with Amazon CloudWatch.
- Your system can now log, measure performance, detect errors early, and send automatic alerts.